
Comparing standard and wave threaded parts using destructive testing
Dale E. Van Cor, Winchester, NH, USA
The Gemini Project started at the Olsen Manufacturing Center at the University of New Hampshire, Durham, NH in July 2019. They used a Markforge
3D printer and Onxy material that is a mix of plastic and chopped carbon fiber. They 3D printed and destructively tested 7/8 inch
and 5/8 inch studs and nuts. Studs have threads on both ends. Previous tests on 3D printed bolts pulled their heads off. The 7/8 inch
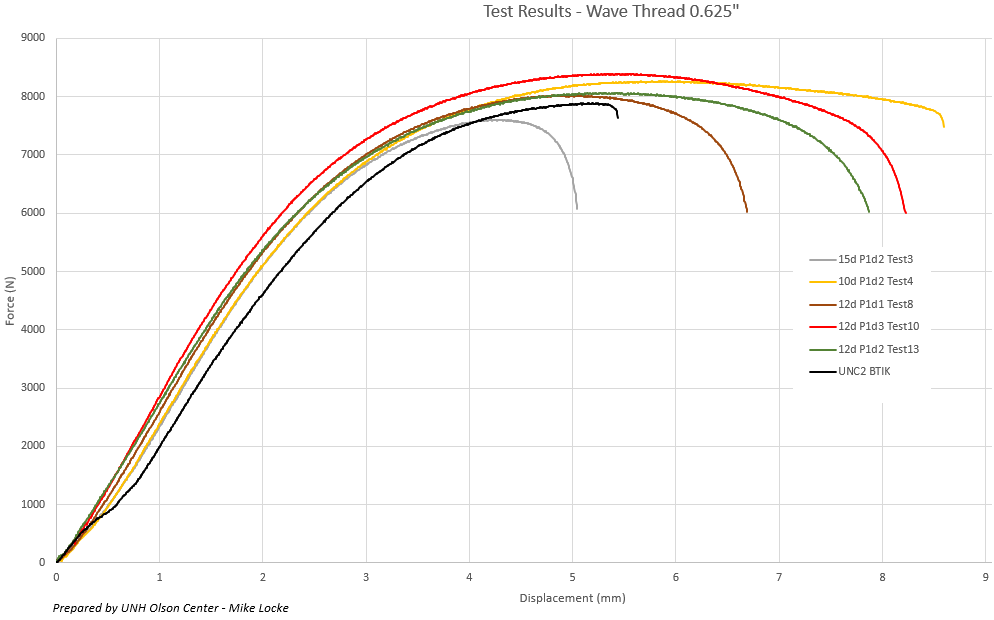
data appeared to have a plateau so the 5/8 inch parts were made to get under that plateau. That also plateaued, but was more interesting.
Metal 3D printed and laser sintered parts are being prepared to be destructively tested in March.
A disclaimer: These are not scientifically valid tests.
It would take 50-100 destructive tests for each model to be scientifically valid and that is currently more then I can afford.
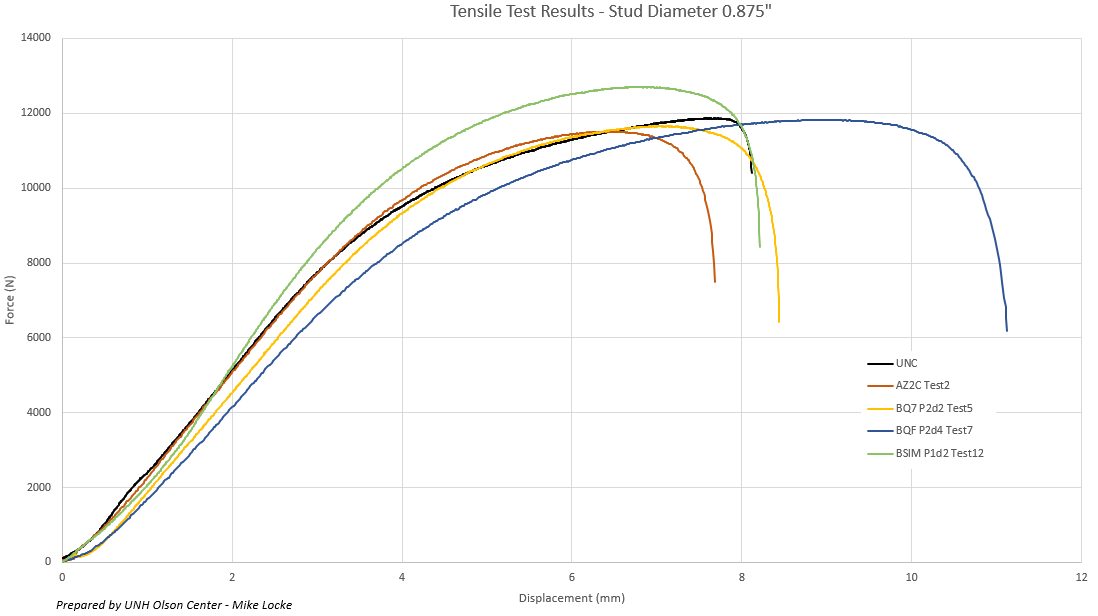
There were 3 of each model. The data was well clustered and the middle results were used in the graph. There is a larger and smaller
value on all of graph lines. They do represent the possibility of what this technology can be and the differences between the models.
The Black lines are the UNC or the standard Unified Course thread. The colored lines are the different models with the matching
colored cross section below showing the different profiles. Unlike the UNC threads, the wave threads are a box of tools with several
variables that can be changed. For the 7/8 inch threads, the same conix angle of 15-degrees was used. That is the angular difference
between the beginning and ending radii.
The period is the width of a sine wave. An amplitude is the height above or below zero of a sine wave, so the net height is twice
the amplitude. The wave thread has a period circle radius where the amplitude of a sine wave is extended above and below that
radii for each point on the circle. This is one of the methods for creating a wave thread.
The period code is p and a p1 on the models means it does not change. A p2 means it doubles its size from the pointed end
to the shank. The code for the amplitude is d. It starts at multiple of amplitudes from the point end to is reduce to the
amplitude height at the shank. A d2 means it is twice the amplitude height and a d4 is four times its height.
What is unknown is how the Onyx material will react to these different geometries. There is no predictive Finite Element
Analysis for this material. The different models were to test some possibilities. The graph is force verses the
displacement (stretching). They all started linear, but at 2/3 of the way, the material started to stretch faster and the
lines curved. Most of the peak values were between 11,600 to 12,700 newtons or 2,500 to 2,800 lbs. for the 7/8. The 5/8 inch diameter
tests was an effort to get straighter lines. They were between 7,600 to 8,400 newtons or 1,670 to 1,850 lbs.
Please note that the 7/8 inch test were a learning curve on the details of video recording. The 5/8 inch videos are much better.


Control click on the video links. The UNC thread exploded as expected on the first thread. They concentrate stress of the thread
while the wave threads distribute stress as seen in this document link. One observation
is that the deeper or the longer the threads, the better they hold. This is still a function of the Onyx materials. One important aspect
of materials that has to be developed by the industry are tests to predict this behavior. The black UNC thread broke explosively.
The yellow 10 Deg p1d2 broke even more explosively because it stored so much energy in its elasticity.


The blue line had deeper threads as shown in the cross section, but more energy went into stretching the shank then resisting the load.
Note on the blue p2d4, the shape of the threads held much longer then the others by stretching more.
The next set of destructive testing will be with 3D printed metal parts from two processes. Desktop Metals in Cambridge,
Mass, USA uses a 3D printing method with an agent that is then baked off. Triditive Additive Manufacturing in Gijón,
Asturias, Spain is using a laser sintering process to build the parts at 30 micron layers by melting powered steel. Testing
will be in March. I am expecting another decimal place in strengths and less stretching.
The goal is more testing with the same threaded parts, but with different materials and fabrication processes. This is an
is to create a future in 3D printed threaded fasteners.
The wave thread is a box of tools. How it conducts heat and how it transmits vibration are improved with the high surface contact. Normal
threads have a clearance space. All of the Van Cor threads have eliminated that and the micromovement that comes with it. This improves
the resistance to fatigue from load cycling, hot/cold cycling and other mechanical stresses that cause fatigue. These threads
expand the utility of what can be made with other materials. It all has to be scientifically proven and engineering tools developed to
predict behavior in different environments.
This will have a greater impact on the gas/fluid connections. Visit the gas/fluid document link
at dataforged.com. Again, the science has to be proven and the predictive engineering tools developed.